PDF extraction › Document
finance · medium document · 14 gold cells · real-source
Byline Bancorp earnings report
Gold v3 · adjudicated · corrected by dispute 002 · labels from llamaindex/ExtractBench · Source PDF ↗ · 24 pages
| System | v3 | Execution | Rows | Pass / fail / missing / extra |
|---|---|---|---|---|
| Codex · GPT-6 Astra · medium effort | 1.000 | completed | — | 14 / 0 / 0 / 0 |
| Codex · GPT-5.6 Sol · medium effort | 1.000 | completed | — | 14 / 0 / 0 / 0 |
| Claude Code · Claude Opus 5 · medium effort | 0.929 | completed | — | 13 / 1 / 0 / 0 |
| Claude Code · Claude Sonnet 5 · medium effort | 1.000 | completed | — | 14 / 0 / 0 / 0 |
Pages


Fields · gold v3 against every system
| Field | Gold · gpt-6-astra · gpt-5.6-sol · claude-opus-5 · claude-sonnet-5 |
|---|---|
| adjusted_ebitda | null wrong? |
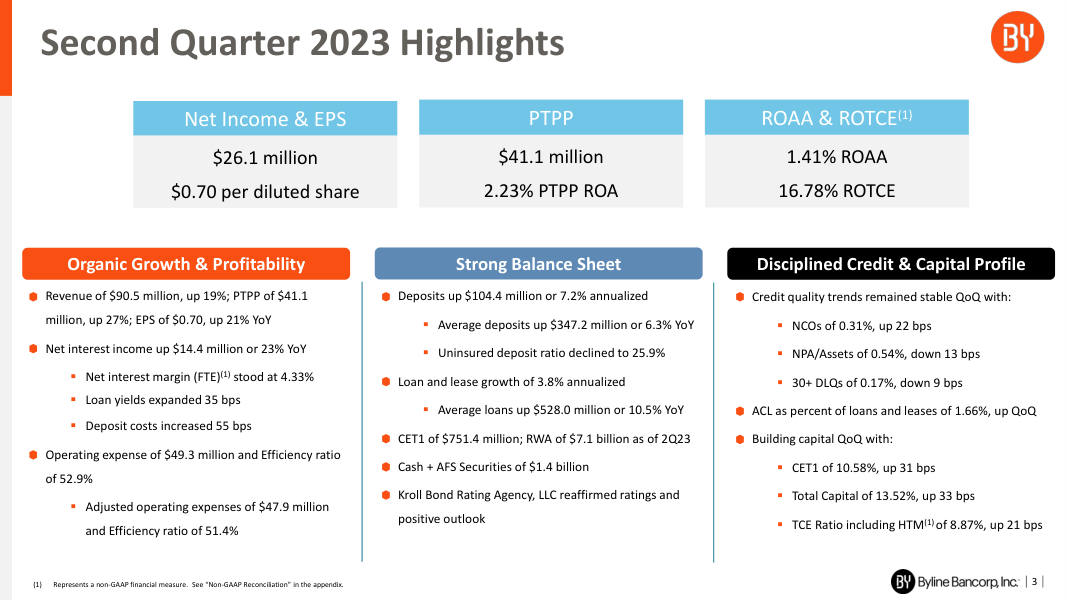
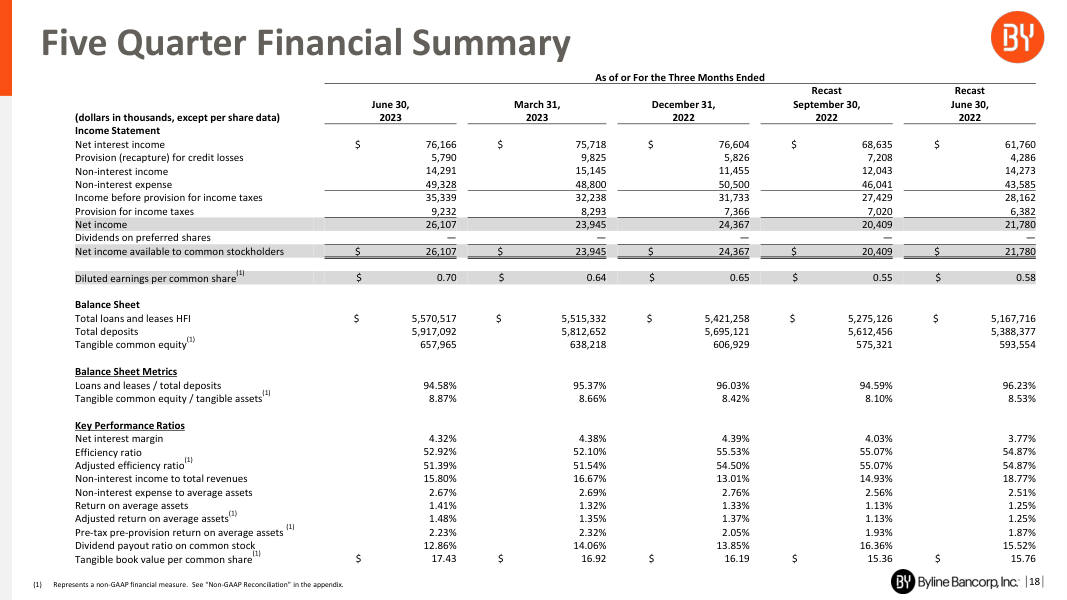
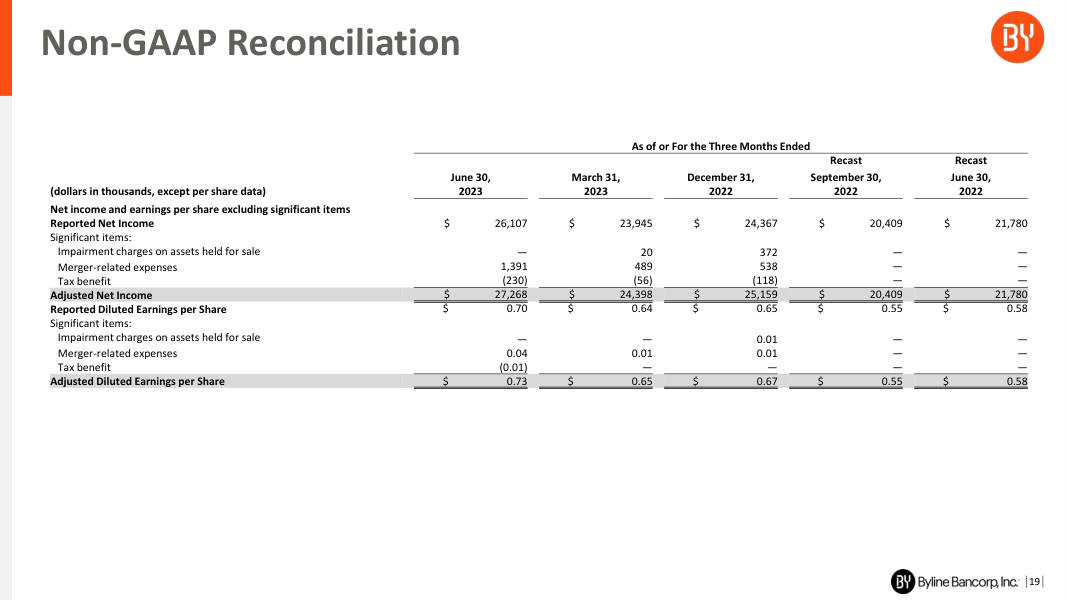
| adjusted_eps_diluted | 0.73 wrong? |
| currency | USD wrong? |
| fiscal_period_end_date | 2023-06-30 wrong? |
| free_cash_flow | null wrong? |
| gaap_eps_diluted | 0.7 wrong? |
| gross_margin | null wrong? |
| gross_profit | null wrong? |
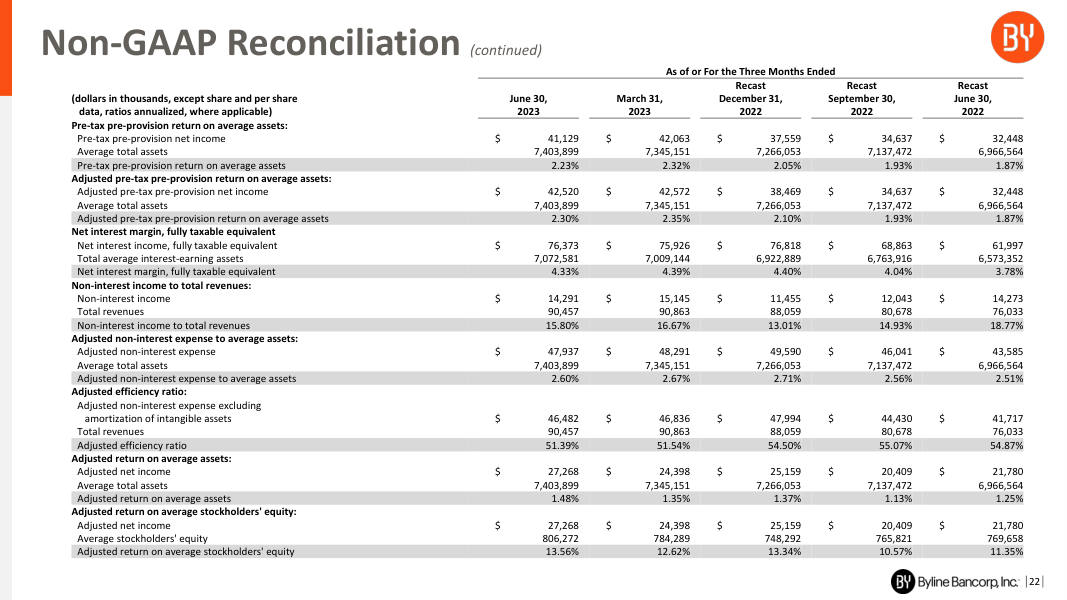
| net_income p.3 p.18 | 26.1 fixed by dispute 002wrong? |
| operating_income | null fixed by dispute 002wrong? |
| operating_margin | null fixed by dispute 002wrong? |
| period | Q2 FY2023 wrong? |
| revenue_growth_yoy p.3 |
19.0
claude-opus-518.97 wrong? |
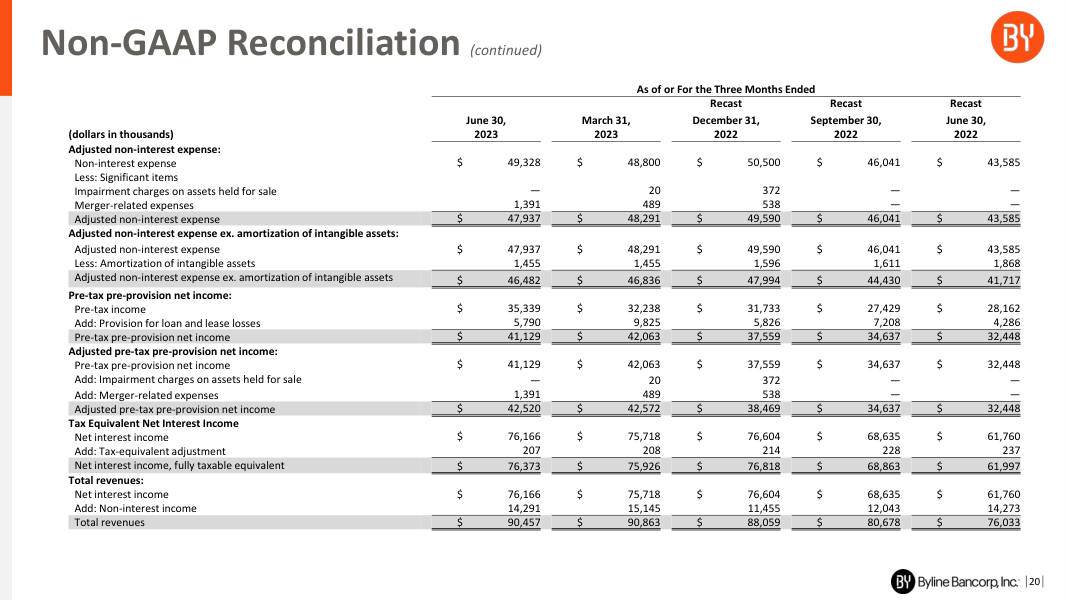
| total_revenue p.3 p.22 | 90.5 fixed by dispute 002wrong? |
Values are shown after the scorer's normalization. Green: matches gold under the pinned scorer, including per-field normalizers and accepted alternates. Red: differs. Grey: absent on one side.
Disputes on this document
Byline Bancorp Q2 2023: headline rounding rule and pre-tax income labeled as operating income · accepted · fields total_revenue, net_income, operating_income, operating_margin
Extraction schema sent to every system
{
  "$defs": {
    "Segment": {
      "properties": {
        "segment_name": {
          "description": "Reportable segment name exactly as printed in the segment P\u0026L table (e.g. \u0027Water Quality\u0027,\u0027Product Quality \u0026 Innovation\u0027,\u0027Fuel Distribution\u0027, Japanese \u0027\u30db\u30fc\u30eb\u30bb\u30fc\u30eb\u4e8b\u696d\u90e8\u9580\u0027). Do NOT confuse with: a geographic region, a product line, a loan-platform name, or the \u0027Total Company\u0027 row. Format: verbatim segment label.",
          "type": "string"
        },
        "segment_profit": {
          "description": "That segment\u0027s GAAP/reported operating profit (segment operating income) for the headline period from the formal segment-results table. IF BOTH a GAAP/reported segment operating profit AND an adjusted/non-GAAP segment profit (adjusted operating profit, segment Adjusted EBITDA/AEBITDA) are shown for the segment, USE THE GAAP FIGURE. Only when NO GAAP segment operating profit is reported, fall back to the adjusted operating profit / segment Adjusted EBITDA / \u7d4c\u5e38\u5229\u76ca the deck labels. Use null if no per-segment profit is reported. Do NOT confuse with: segment revenue, segment margin (a percent), adjusted segment profit when a GAAP one exists, or total-company profit. Format: number in the reporting unit (MILLIONS unless the segment table states otherwise), no currency symbol.",
          "type": [
            "number",
            "null"
          ]
        },
        "segment_revenue": {
          "description": "That segment\u0027s revenue/sales for the headline period. Aliases under the segment: \u0027Sales\u0027,\u0027Revenue\u0027,\u0027Net sales\u0027; Japanese segment \u696d\u52d9\u7c97\u5229\u76ca/\u7d4c\u5e38\u53ce\u76ca line. Use null if the segment table gives only profit, not revenue. Do NOT confuse with: total-company revenue, segment profit, loan receivables, or a growth percent. Format: number in reporting currency in MILLIONS, no symbol.",
          "type": [
            "number",
            "null"
          ]
        }
      },
      "required": [
        "segment_name"
      ],
      "type": "object"
    }
  },
  "description": "Headline financial-highlights KPIs from a quarterly/annual earnings or investor deck. WHICH PERIOD: extract the period whose name appears as the heading of the deck\u0027s HEADLINE financial-highlights slide (the slide presenting the consolidated KPI tiles such as Sales / EPS / EBITDA). If that slide\u0027s heading says \u0027Full Year YYYY\u0027 use the FULL FISCAL YEAR; if it says a quarter (e.g. \u0027Q1 2026\u0027, \u00274Q25\u0027) use that QUARTER; for a Japanese \u6c7a\u7b97\u77ed\u4fe1 use the current reporting fiscal year (the first/topmost year, e.g. \u00272024\u5e743\u6708\u671f\u0027), NOT the prior-year comparative and NOT the next-year forecast (\u696d\u7e3e\u4e88\u60f3). NEVER use a GUIDANCE / OUTLOOK / forecast period or a guidance range value. Every monetary figure is in MILLIONS of the reporting currency unless stated otherwise below.\n\nGLOBAL CONVENTIONS: (1) PERIOD \u2014 every scalar KPI must come from the SAME headline reporting period column; for a quarterly deck use the current-quarter column, never the year-to-date/full-year column. (2) ROUNDING \u2014 percentages/margins are reported to 2 decimal places; a currency metric presented as a rounded headline figure on a highlights/summary slide (e.g. \u0027$2.1B\u0027) is captured as that rounded value (2100), not recomputed from reconciliation detail.",
  "properties": {
    "adjusted_ebitda": {
      "description": "TOTAL/consolidated Adjusted EBITDA (non-GAAP) for the headline period. Aliases: \u0027Adjusted EBITDA\u0027,\u0027Adj. EBITDA\u0027,\u0027AEBITDA\u0027. Use the company-wide ACTUAL for the headline period only. Use null if the deck reports only unadjusted EBITDA, only a guidance range, or no consolidated EBITDA. Do NOT confuse with: a SEGMENT\u0027s Adjusted EBITDA, EBITDA MARGIN (a percent), a guidance/forecast range, or operating income. Format: number in reporting currency in MILLIONS, no symbol (e.g. 1379; 2800 for $2.8B). Convert billions to millions. If a highlights/summary slide presents a rounded figure (e.g. \u0027$2.1B\u0027), capture that rounded headline value (2100), not a recomputed reconciliation figure.",
      "type": [
        "number",
        "null"
      ]
    },
    "adjusted_eps_diluted": {
      "description": "ADJUSTED (non-GAAP) DILUTED earnings-per-share ACTUAL for the headline period \u2014 applies ONLY when the issuer reports an explicit \u0027Adjusted EPS\u0027 / \u0027Adjusted diluted EPS\u0027 / \u0027Adjusted Net Diluted Earnings Per Share\u0027 / \u0027Non-GAAP EPS\u0027 line. Use the reported full-period ACTUAL only. MUST be null when: no non-GAAP EPS line exists; the issuer is a REIT reporting FFO/AFFO/Core FFO per share (those are NOT adjusted EPS \u2014 return null); or the only figure shown is a GUIDANCE/OUTLOOK range or guidance midpoint. Do NOT confuse with: GAAP diluted EPS, basic adjusted EPS, guidance ranges, Core FFO/AFFO per share, or distributable-cash-flow per unit. Format: number per share in reporting currency (e.g. 3.90, 1.04).",
      "type": [
        "number",
        "null"
      ]
    },
    "currency": {
      "description": "ISO-4217 currency code of the reported figures: \u0027USD\u0027,\u0027JPY\u0027,\u0027EUR\u0027,\u0027GBP\u0027. Infer from the currency symbol ($=USD, \u00a5/\u5186=JPY). Do NOT confuse with a secondary currency mentioned in geographic commentary. Format: 3-letter uppercase code.",
      "type": [
        "string",
        "null"
      ]
    },
    "fiscal_period_end_date": {
      "description": "Last calendar day of the reported period (the SAME period as `period`), ISO \u0027YYYY-MM-DD\u0027. A Full Year 2025 ending December 31, 2025 =\u003e \u00272025-12-31\u0027; Japanese \u00272024\u5e743\u6708\u671f\u0027 =\u003e \u00272024-03-31\u0027; a fiscal quarter uses its printed end date. Do NOT confuse with: the report/publication date, the prior-year comparative end date, or a guidance period end. Format: \u0027YYYY-MM-DD\u0027.",
      "type": [
        "string",
        "null"
      ]
    },
    "free_cash_flow": {
      "description": "Free cash flow (non-GAAP) ACTUAL for the headline period. Aliases: \u0027Free cash flow\u0027,\u0027FCF\u0027,\u0027Free cash flow (non-GAAP)\u0027. Use the headline-period total actual. Do NOT confuse with: cash from operations, FCF CONVERSION % (a ratio), distributable cash flow (DCF), or a guidance value. Format: number in reporting currency in MILLIONS, no symbol. Use null if FCF is not reported.",
      "type": [
        "number",
        "null"
      ]
    },
    "gaap_eps_diluted": {
      "description": "GAAP DILUTED earnings per share for the headline period. Aliases: \u0027Diluted EPS\u0027,\u0027Net income per common share - diluted\u0027,\u0027Diluted earnings per share\u0027,\u0027Reported (GAAP) ... diluted net earnings per common share\u0027; Japanese \u0027\u6f5c\u5728\u682a\u5f0f\u8abf\u6574\u5f8c1\u682a\u5f53\u305f\u308a\u5f53\u671f\u7d14\u5229\u76ca\u0027 (use the diluted figure, NOT the basic \u00271\u682a\u5f53\u305f\u308a\u5f53\u671f\u7d14\u5229\u76ca\u0027) of the current fiscal year. Must be GAAP/reported, not adjusted. Do NOT confuse with: ADJUSTED/non-GAAP diluted EPS, BASIC EPS, per-share dividend, or FFO/AFFO per share. Format: number per share in reporting currency, decimals exactly as printed (e.g. 0.24, 2.27, 3.76, 724.34).",
      "type": [
        "number",
        "null"
      ]
    },
    "gross_margin": {
      "description": "GAAP (as-reported) gross profit margin (percent) for the headline period. Aliases: \u0027Gross profit margin\u0027,\u0027Gross margin\u0027. Use the \u0027Reported (GAAP)\u0027 gross-profit-margin value when both GAAP and Adjusted are shown. Use null if the issuer reports no gross profit. Do NOT confuse with: ADJUSTED gross margin, operating/EBITDA margin, or net interest margin. Format: percent as a plain number, e.g. 59.9. Round to 2 decimal places.",
      "type": [
        "number",
        "null"
      ]
    },
    "gross_profit": {
      "description": "GAAP (as-reported, NOT adjusted) gross profit for the headline period = Sales minus Cost of sales. Alias: \u0027Gross profit\u0027. If the issuer\u0027s headline reconciliation shows Sales and Cost of sales but no explicit gross-profit line, compute Sales - |Cost of sales|. Use null if the issuer reports no gross-profit concept (banks, REITs, MLPs). Do NOT confuse with: gross MARGIN (a percent), ADJUSTED gross profit, net revenue, or operating profit. Format: number in reporting currency in MILLIONS, no symbol.",
      "type": [
        "number",
        "null"
      ]
    },
    "net_income": {
      "description": "GAAP net income/earnings for the headline period. Use the bottom-line \u0027Net income\u0027/\u0027Net earnings\u0027 line ATTRIBUTABLE TO THE COMPANY (after deducting non-controlling interests when an NCI line exists); for a Japanese filing use \u0027\u89aa\u4f1a\u793e\u682a\u4e3b\u306b\u5e30\u5c5e\u3059\u308b\u5f53\u671f\u7d14\u5229\u76ca\u0027 of the current fiscal year. If a \u0027Net income attributable to common stockholders\u0027 line exists (after NCI but before preferred dividends), prefer it over a separate \u0027available to common \u2014 after preferred dividends\u0027 line. Do NOT confuse with: adjusted/non-GAAP net income, net income BEFORE NCI, comprehensive income (\u5305\u62ec\u5229\u76ca), pre-tax/operating income, or \u0027available to common after preferred dividends\u0027. Format: number in reporting currency in MILLIONS, no symbol.",
      "type": [
        "number",
        "null"
      ]
    },
    "operating_income": {
      "description": "GAAP (as-reported, NOT adjusted) operating income/profit for the headline period. Aliases: \u0027Operating income\u0027,\u0027Operating profit\u0027,\u0027Income from operations\u0027; for a Japanese bank use \u0027\u7d4c\u5e38\u5229\u76ca\u0027 (ordinary profit) of the current fiscal year. Use the line labeled \u0027Reported (GAAP)\u0027 when both GAAP and Adjusted are shown. Do NOT confuse with: ADJUSTED operating profit/margin, EBITDA, gross profit, pre-tax earnings, or net income. Format: number in reporting currency in MILLIONS, no symbol.",
      "type": [
        "number",
        "null"
      ]
    },
    "operating_margin": {
      "description": "GAAP (as-reported) operating margin (percent) for the headline period = GAAP operating_income / total_revenue. Aliases: \u0027Operating margin\u0027,\u0027Operating profit margin\u0027 on the \u0027Reported (GAAP)\u0027 line. Use null if only an ADJUSTED operating profit margin is shown and no GAAP one. Do NOT confuse with: ADJUSTED operating profit margin, gross margin, EBITDA margin, net interest margin, or \u7d4c\u5e38\u5229\u76ca\u7387 (which is ordinary-profit-to-revenue and may be reported separately \u2014 only use it if it is the GAAP operating margin). Format: percent as a plain number, e.g. 23.2. Round to 2 decimal places (e.g. -0.08 means -0.08%).",
      "type": [
        "number",
        "null"
      ]
    },
    "period": {
      "description": "Fiscal period of the headline ACTUALS, formatted \u0027Qx FYYYYY\u0027 for a quarter (e.g. \u0027Q1 FY2026\u0027) or \u0027FYYYYY\u0027 for a full fiscal year (e.g. \u0027FY2025\u0027). Aliases seen on the page: \u0027Q4 2025\u0027,\u00274Q25\u0027,\u00271Q\u002726\u0027,\u0027Full Year 2025\u0027,\u0027FY25\u0027,\u00272024\u5e743\u6708\u671f\u0027(=fiscal year ended March 2024 =\u003e \u0027FY2024\u0027). RULE: if the headline highlights slide is titled \u0027Full Year YYYY\u0027 the period is \u0027FYYYYY\u0027 even when the overall deck is titled \u0027Qx\u0027; a Japanese \u6c7a\u7b97\u77ed\u4fe1\u0027s headline is the current fiscal year (FY of the FIRST data row). Do NOT confuse with: the prior-year comparative period, or a forward guidance/forecast year. Format: \u0027Qx FYYYYY\u0027 or \u0027FYYYYY\u0027.",
      "type": [
        "string",
        "null"
      ]
    },
    "revenue_growth_yoy": {
      "description": "Year-over-year growth of TOTAL REPORTED total_revenue for the headline period = (this period total_revenue / prior period total_revenue - 1). Use the TOTAL/AS-REPORTED revenue growth that ties to total_revenue, NEVER \u0027core\u0027, \u0027organic\u0027, \u0027same-store\u0027, or \u0027constant-currency\u0027 growth even when those are more prominent on the slide. For a Japanese \u6c7a\u7b97\u77ed\u4fe1 use the \u0027\uff05\u0027 on the \u7d4c\u5e38\u53ce\u76ca row of the current fiscal year. Do NOT confuse with: core/organic/same-store/constant-currency sales growth, segment growth, volume growth, or a margin change in bps. Format: percent as a plain number, e.g. 6.0; negative for a decline (e.g. -2.3). Round to 2 decimal places.",
      "type": [
        "number",
        "null"
      ]
    },
    "segments": {
      "description": "Reportable business/operating SEGMENTS from the deck\u0027s SEGMENT P\u0026L table (segment Sales/Revenue and/or segment Profit/Operating profit/AEBITDA) for the headline period. INCLUDE only genuine income-statement reportable segments. EXCLUDE: \u0027Total Company\u0027/\u0027Consolidated\u0027/eliminations/subtotal rows, AND any table that is NOT a P\u0026L segment breakdown (e.g. loan-receivables \u0027by platform\u0027 asset tables, geographic regions, or product categories are NOT segments). Return an EMPTY array if the deck has no per-segment P\u0026L (revenue or profit) table.",
      "items": {
        "$ref": "#/$defs/Segment"
      },
      "type": "array"
    },
    "total_revenue": {
      "description": "Top-line revenue for the headline period. PICK THE TOPMOST/most-inclusive revenue line of the issuer\u0027s income statement: for an industrial use \u0027Total revenue\u0027/\u0027Net sales\u0027/\u0027Sales\u0027; for a BANK/credit-card issuer use the topmost \u0027Interest income\u0027 or \u0027Total revenues\u0027 line (NOT net interest income, NOT total ordinary income\u0027s sub-lines); for a Japanese bank use \u0027\u7d4c\u5e38\u53ce\u76ca\u0027 (ordinary income, the FIRST/topmost revenue figure). Do NOT confuse with: a single SEGMENT\u0027s revenue, NET interest income (a sub-total after interest expense), gross profit, operating income, or a prior-year comparative. Format: number in reporting currency in MILLIONS, no symbol, no thousands separators (e.g. 5503; 9353590 for \u00a59,353,590 million; 685.25 for $685,250 thousand =\u003e keep as 685.25). If the deck reports the figure ONLY in BILLIONS, multiply by 1000 to express millions (e.g. $42B =\u003e 42000, $5.6bn =\u003e 5600). NEVER report a billions-scale value like 42 or 5.6 for a figure that is actually billions.",
      "type": [
        "number",
        "null"
      ]
    }
  },
  "title": "EarningsDeckHeadlineKPIs",
  "type": "object"
}